19.0
New
Filters (new UI)
The logic of filters (logbooks, reports) has been a bit "redesigned". Because all filters are connected with "AND" logical operation was in the all UI all options selected by default to let the data pass through.

In the new UI there is no selection in the filter by default.

It actually means that the filter is off (make no filtering) and the behavior is the same as if all the options would be selected.
You can activate the filter by selecting on or more options. In this case the filter changes the color to visually indicate that it is active. The color is still subject of change.

Alive monitoring
PDM alive status is mapped to status messages 1300 (offline) and 1301 (online). You can use message forwarding in the same way as if the status messages would be sent form PDM. This function doesn’t work instantly. PDM.control checks regularly the alive state of PDM and compare it with previous state. If there is a change a status message is generated.
Previous alive monitor (background icon) is removed.
You can fine tune the behavior in configuration (default values are shown)
pcon:
  alive-monitor:
    # Defines how oft PDM check the alive status of PDM
    check-delay: 5m
    # Uncertainty which will be added to keep alive interval to avoid quick changes due to time synchronization of network delays
    uncertainty: 3m
    # This value will be used as keep alive duration if PDM doesn't indicate it (e.g. PDM 5, or PDM 7 with very old firmware).
    default-alive: 12h
Searchable PDMs
A PDMs within each areas are searchable. Click on search icon (1) and type name or number (2). Matching items will be shown with highlight.

Remote monitoring
Since this version will PDM.control gets some health and metrics reports. For this purpose a spring a spring actuator will be used.
It is it allowed only health report by default.
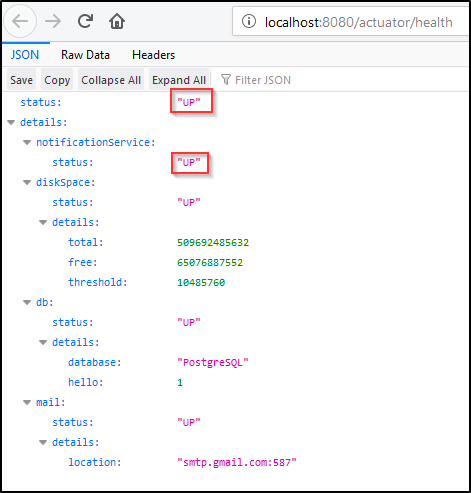
It is shown to all logged on users on URL /actuator/health.
Currently there is only support for monitoring.
You may see the status like this:
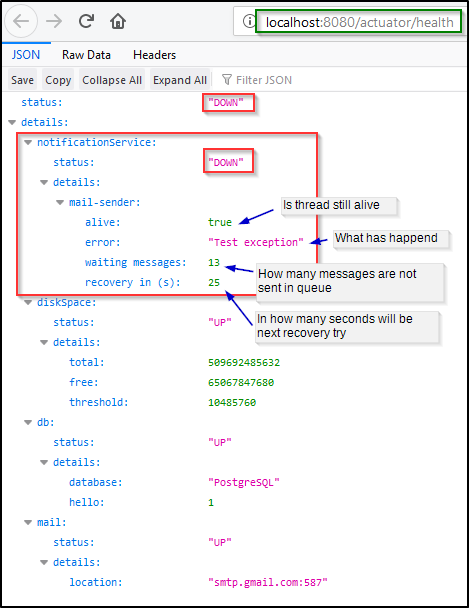
In case that there is a problem (in notification component) detected you will see what is going on in like this:
You can also enable other actuators.
management:
  endpoints:
    web:
      exposure:
        include:
        - health (1)
        - metrics (2)
        - prometheus (3)
- caches (4)| 1 | You have to include this actuator as well. This definition overwrites default. |
| 2 | Application metrics. Currently the is interesting only JVM metrics. More come in next version. |
| 3 | Connector for Prometheus monitoring. |
| 4 | Empty now. Something can comme in next versions. |
Other
-
Differentiation of payment card types with picture (only new UI)
-
Forward-able alive status. The old way to indicate communication status by background image in maintenance monitor has been removed.
-
[PCON-1759] - Remote commands for closing/opening the output tray
-
Following reports has been migrated to the new UI:
-
Revenue / Amount
-
Revenue / Pdm
-
Revenue / End of day
-
Revenue / Summary
-
-
Added texts for new status messages
-
Transaction number is visible in status message log book.
-
PDM can be deleted from new UI. Go down on PDM page and locate settings rectangle. Delete button is next to the Submit button. I’m not convinced that this placed proposed by the company is ideal. I may move the button somewhere else in the future release.
-
[PCON-1779] - As a customer I want to have a column with clearing number.
-
[PCON-1804] - As a customer I want to sort Areas by numbers on projects page.
-
Added Slovenian language to new UI.
-
Added Italian language to new UI.
Improvements
-
Increased speed of filter loading (*books and reports).
-
[PCON-1766] - Change direction of bar graph for paper supply.
-
[PCON-1824] - Add message number and PDM time for "Open messages".
Bug fixes
-
[PCON-1637] - Action on some pages don’t work with mobile devices. Those reports has been re-created with new UI.
-
[PCON-1833] - Xls files from PDM.Control are 1 hour behind during Winter Time
-
[PCON-1896] - Fixed error in notification thread e-mail message forwarding
Notes
Filters (new UI) The logic of filters (logbooks, reports) has been a bit “redesigned”. Because all filters are connected with “AND” logical operation was in the all UI all options selected by default to let the data pass through.